Kyiv time9:41am•5 November, 2026
All work
Case study · Enterprise forecasting

GAAPT

GAAPT is a forecasting platform for an audit and assurance business: leadership uses it to see revenue, profit and headcount years ahead, and finance teams feed it the data. The legacy tool showed everything at once: one endless page of charts, tables without structure, country filters that disappeared once applied. As the product's only designer after discovery, I talked to users twice a week, cut what nobody used and rebuilt the dashboard, tables and admin tools around how people actually read a forecast.

Enterprise forecasting tool for an audit and assurance business. Legacy system redesigned end to end.

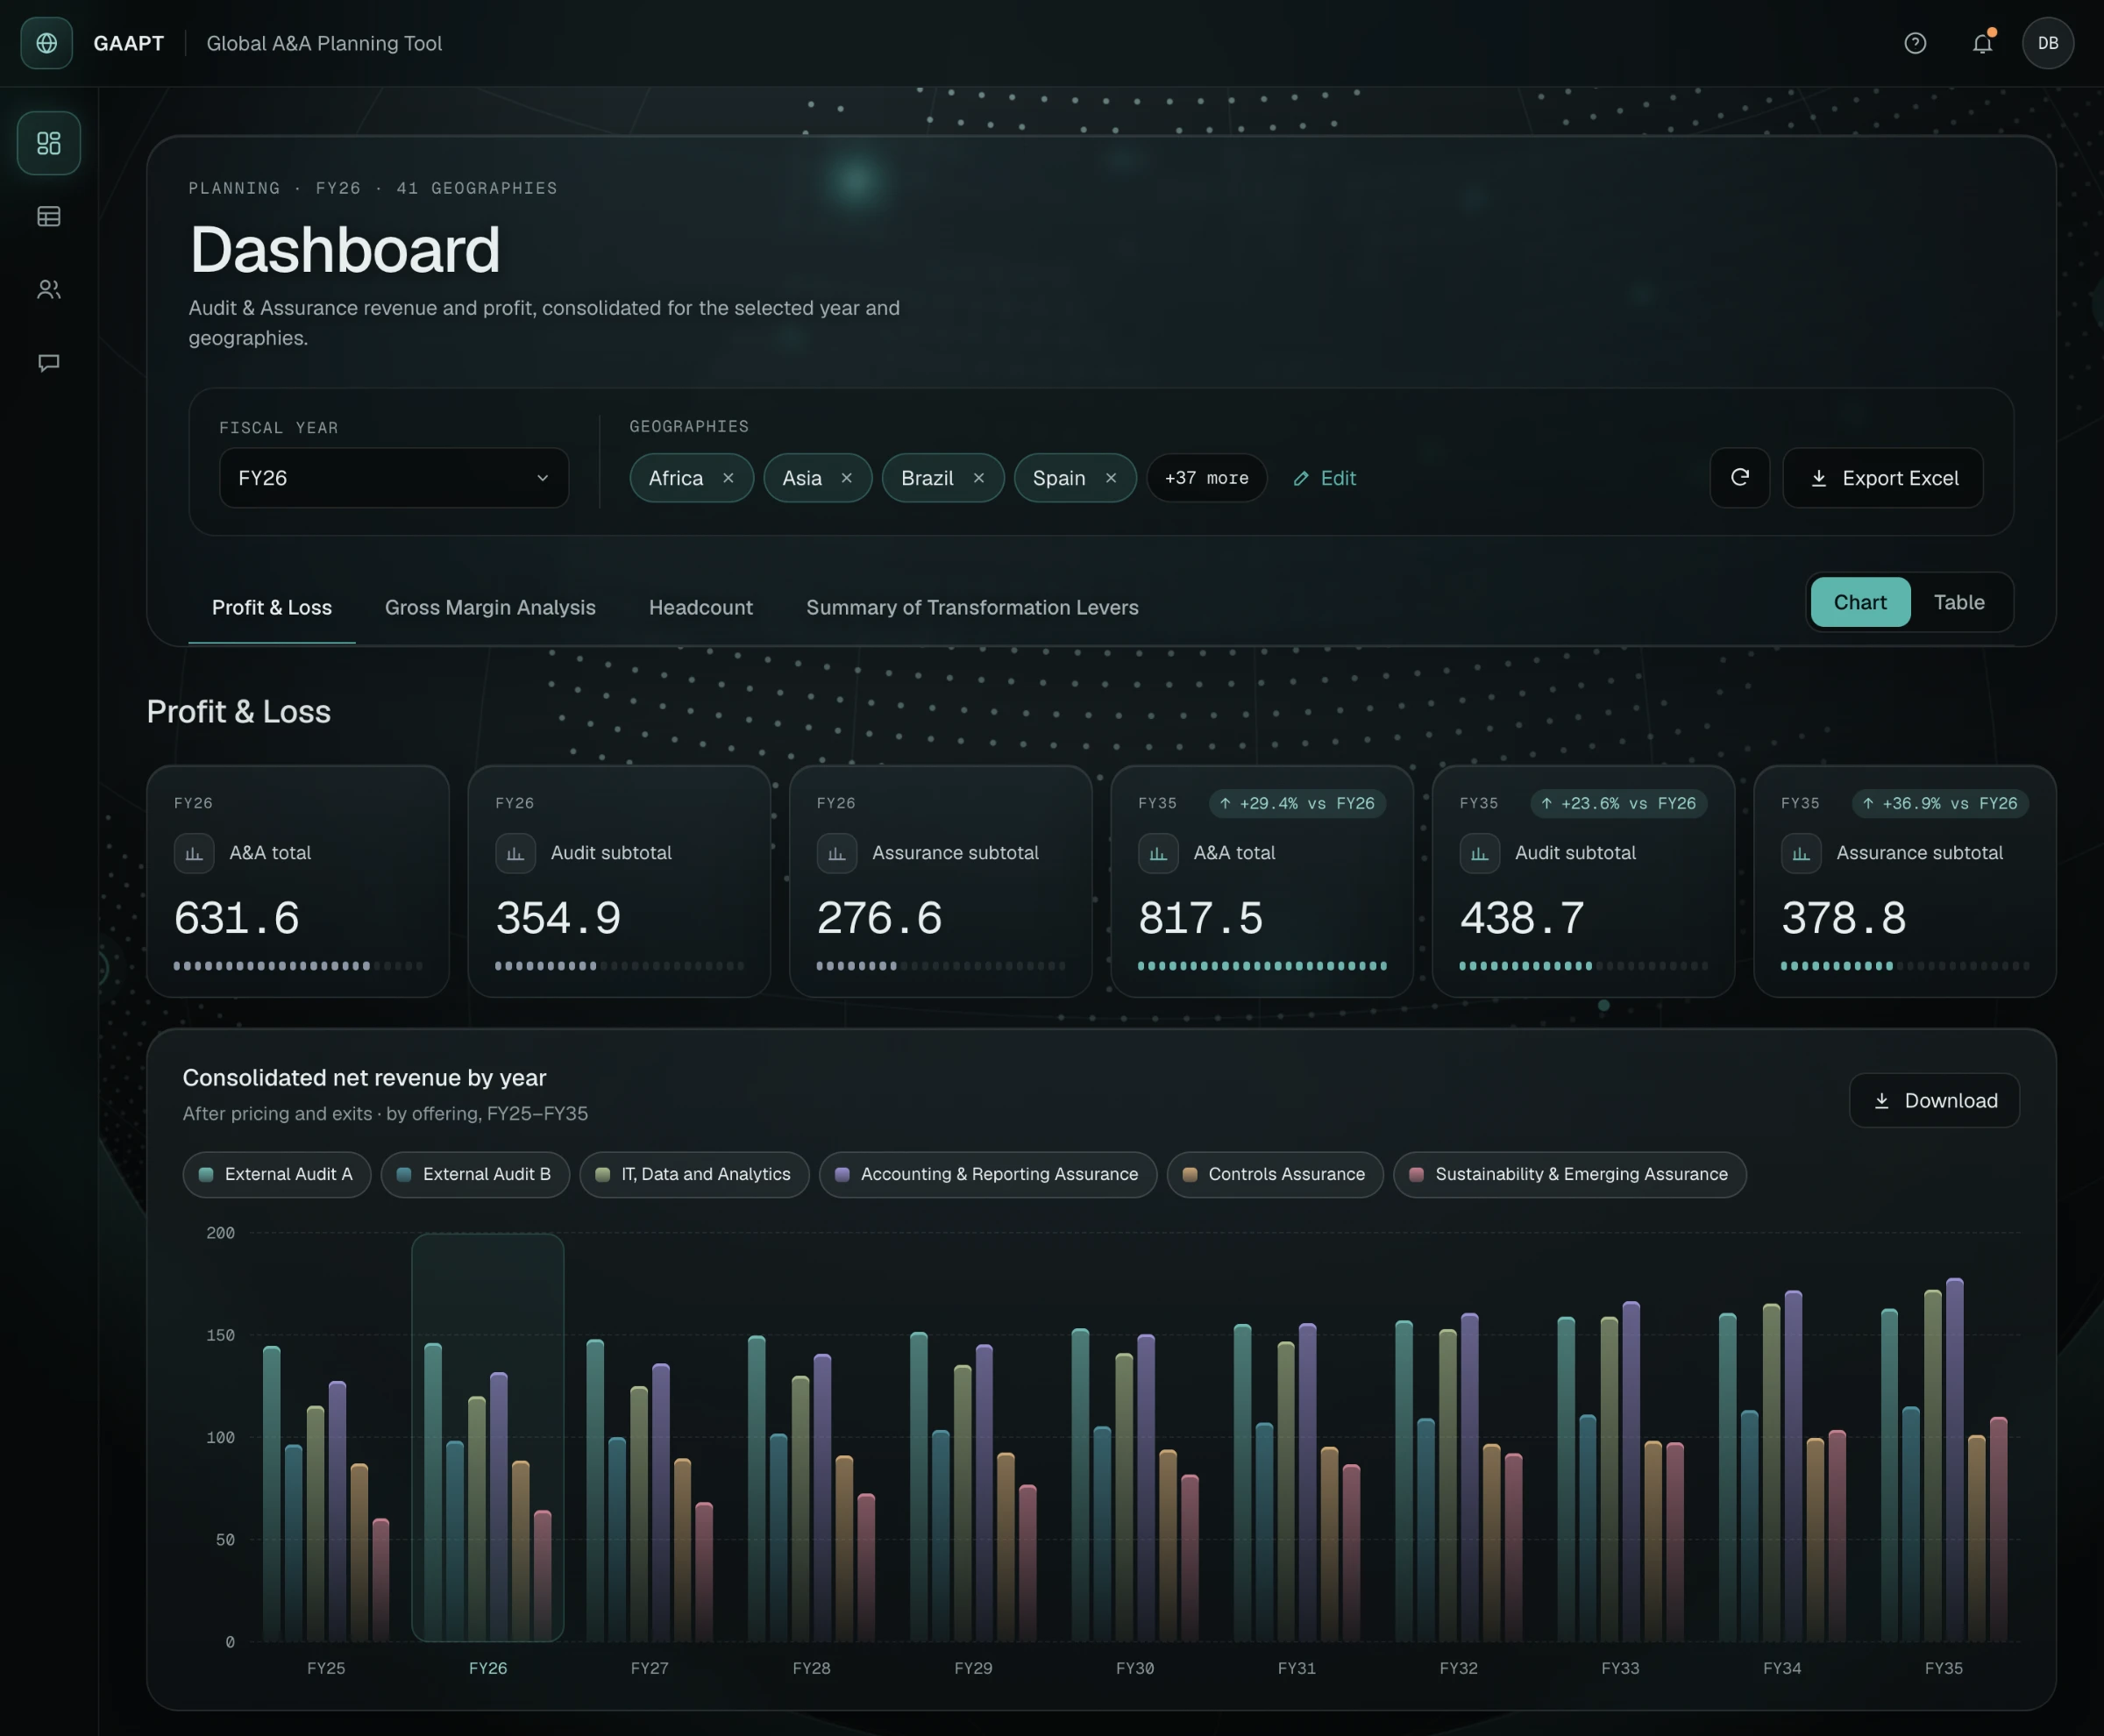
Redesigned forecasting dashboard in a dark theme: selected countries as chips in the header, four tabs, six KPI tiles and a grouped revenue chart over a dotted globe.
The redesigned Profit & Loss dashboard: country filters, four tabs and one chart system.
Problem
A legacy forecasting tool showed everything at once: one endless page of charts, tables without structure, country filters that vanished once applied.
What I did
As the only designer after discovery, I talked to users twice a week, cut what nobody used and rebuilt the dashboard, tables and admin tools.
Outcome
Countries stay in view, the dashboard splits into four tabs, tables open by level, and admins manage users and notifications without developers.
01Context and role

Context and role

GAAPT forecasts revenue, profit, headcount and resources for an audit and assurance business several fiscal years ahead. Two groups use it: senior leaders who check the forecast for their countries about once a week, and finance teams who enter the numbers.

I was the only designer on the product. A design lead joined discovery and the first delivery; after that, discovery, communication with the client and the redesign of every page were mine, including working through the data to decide what each screen should show.

02The problem

The problem

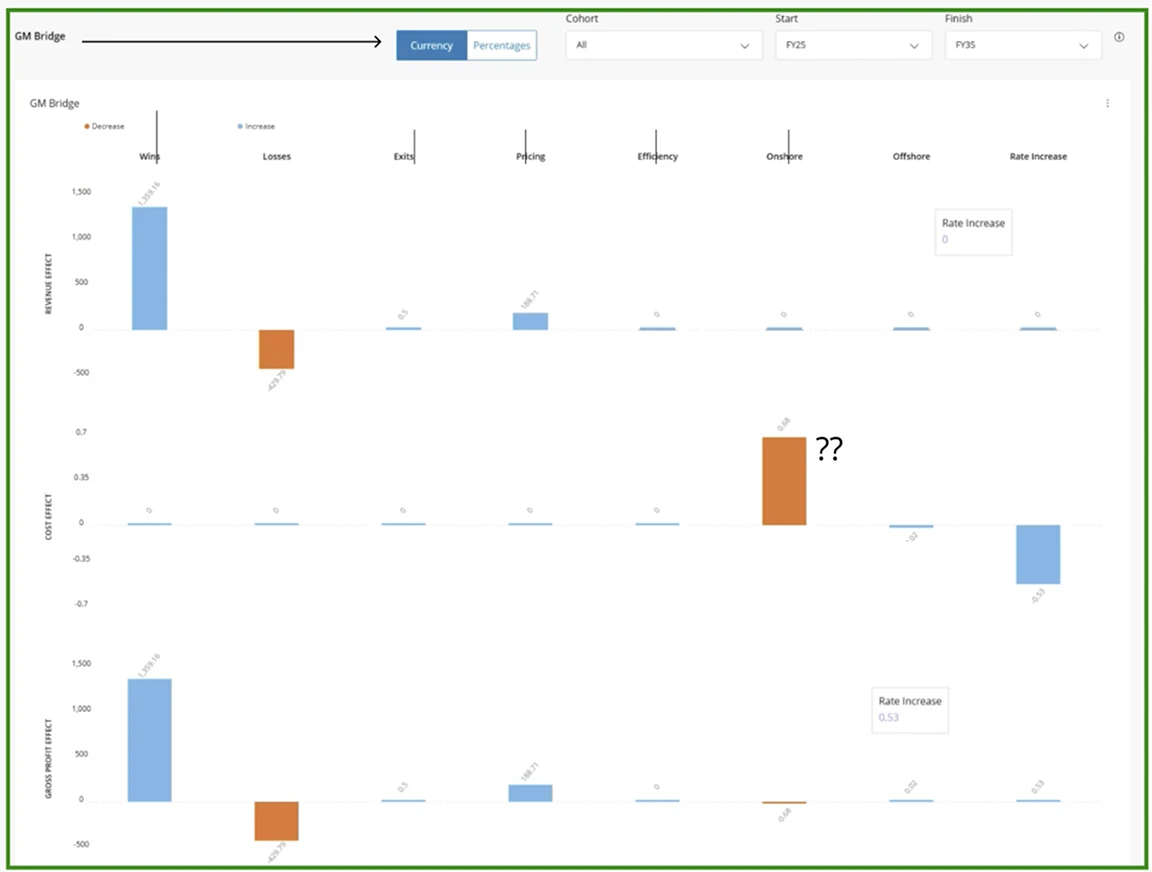
The data was never the issue: there was a lot of it, before and after. The issue was that all of it arrived at once. The dashboard was one long page of charts in no particular order, so the chart you needed sat somewhere below the ones you didn't. Charts were hard to read: one bridge was split into three separate graphs, and the numbers in the headcount pyramid only appeared on hover. Tables ran sideways past the edge of the screen. And the countries a user picked before opening the dashboard were nowhere on it.

03Research

What users told us

We spoke with users about twice a week in live calls, with both the leaders and the finance teams, going through the problems they had hit that week.

  • Many charts went unused

    Users relied on a handful of views. The rest only added scroll and load time, so we cut them or moved them down.

  • The country context got lost

    Users chose countries before opening the dashboard, then couldn't see the choice. One mistake meant going back and starting over.

  • One table, many audiences

    The data-entry table was one long sheet, yet it split into clear blocks, and each level of manager needed a different depth.

04Key decisions

Key decisions

Decision 01

Countries stay visible on the dashboard

The problem

Countries were chosen on a separate step and disappeared once the dashboard loaded.

Before
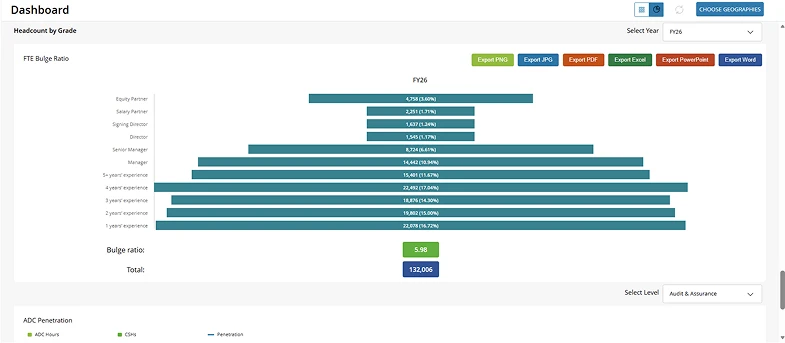
Legacy dashboard: a "Choose geographies" button with no selected countries visible, above a headcount pyramid with six coloured export buttons.
Countries chosen elsewhere, invisible on the dashboard.
After
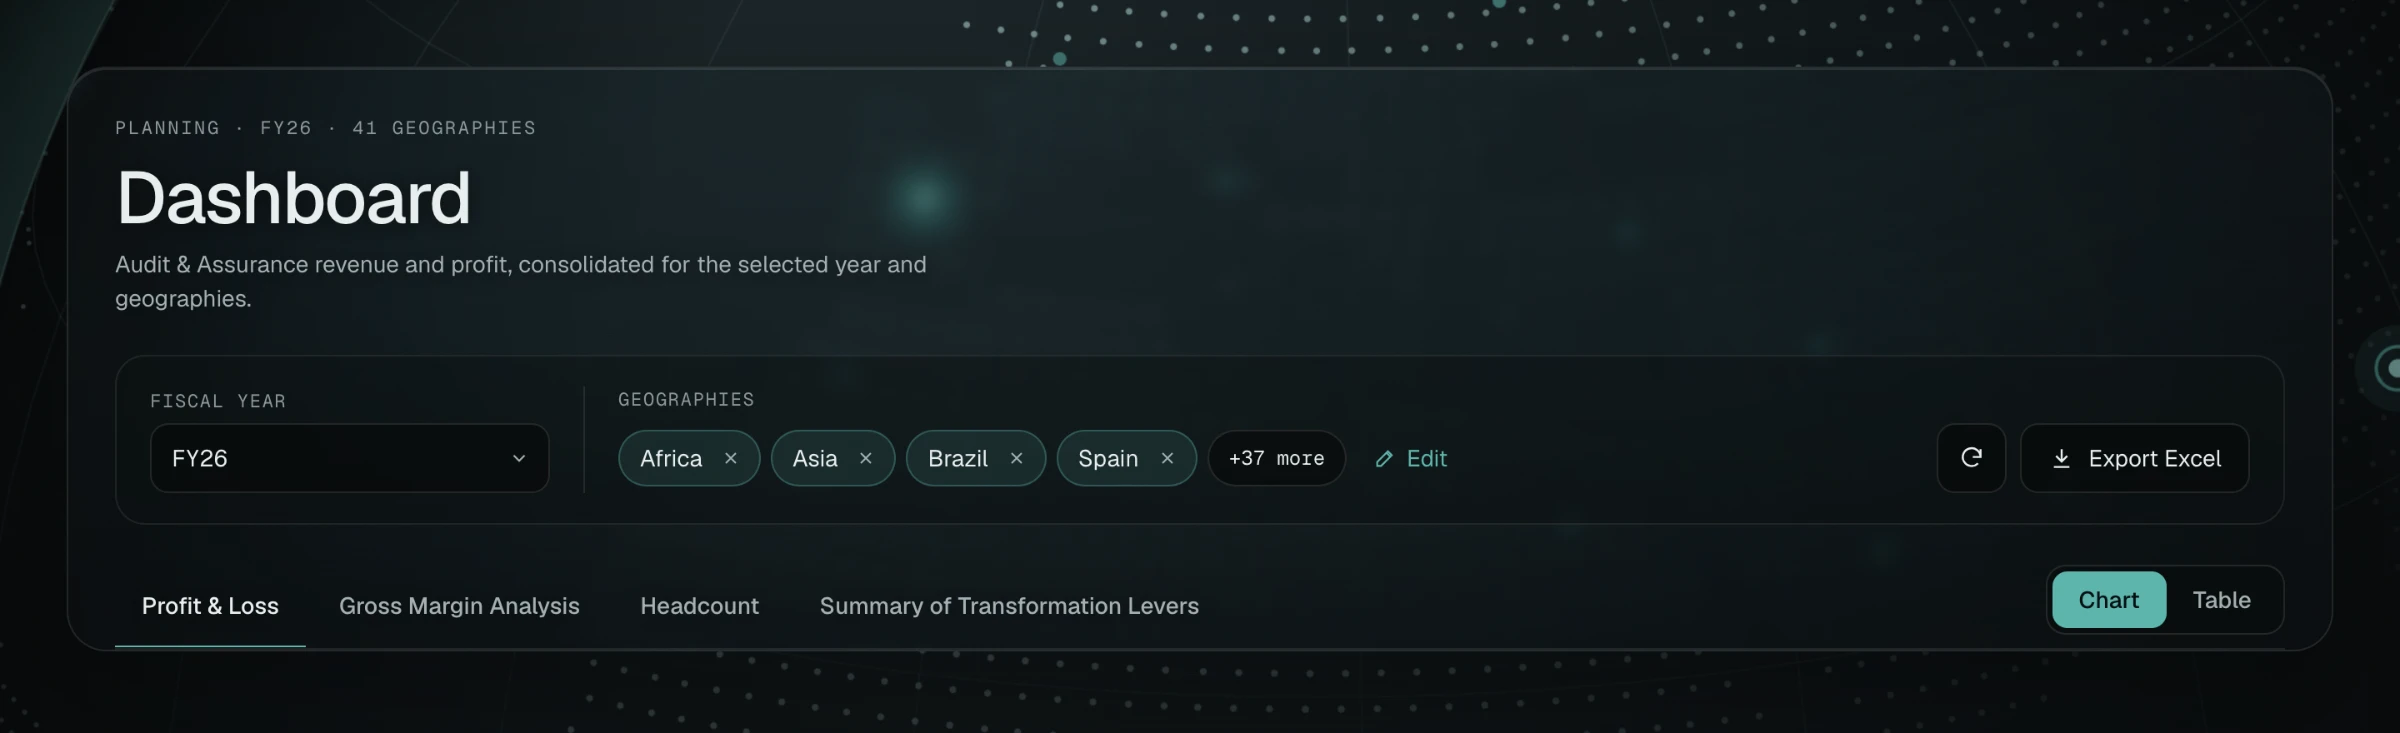
Dashboard header with a fiscal year selector, four selected countries as removable chips, a "+37 more" chip and an Edit link.
Selected countries in the header, editable in place.

Why

The selection now lives in the dashboard header as chips, with Edit next to them. Users see what the numbers include and change it in place, without going back.
Decision 02

One endless page → four tabs

The problem

Every chart sat on one long page, in no particular order.

Before
Legacy gross margin bridge split into three separate graphs for revenue, cost and profit effect, with a review annotation.
One bridge split into three separate graphs.
After
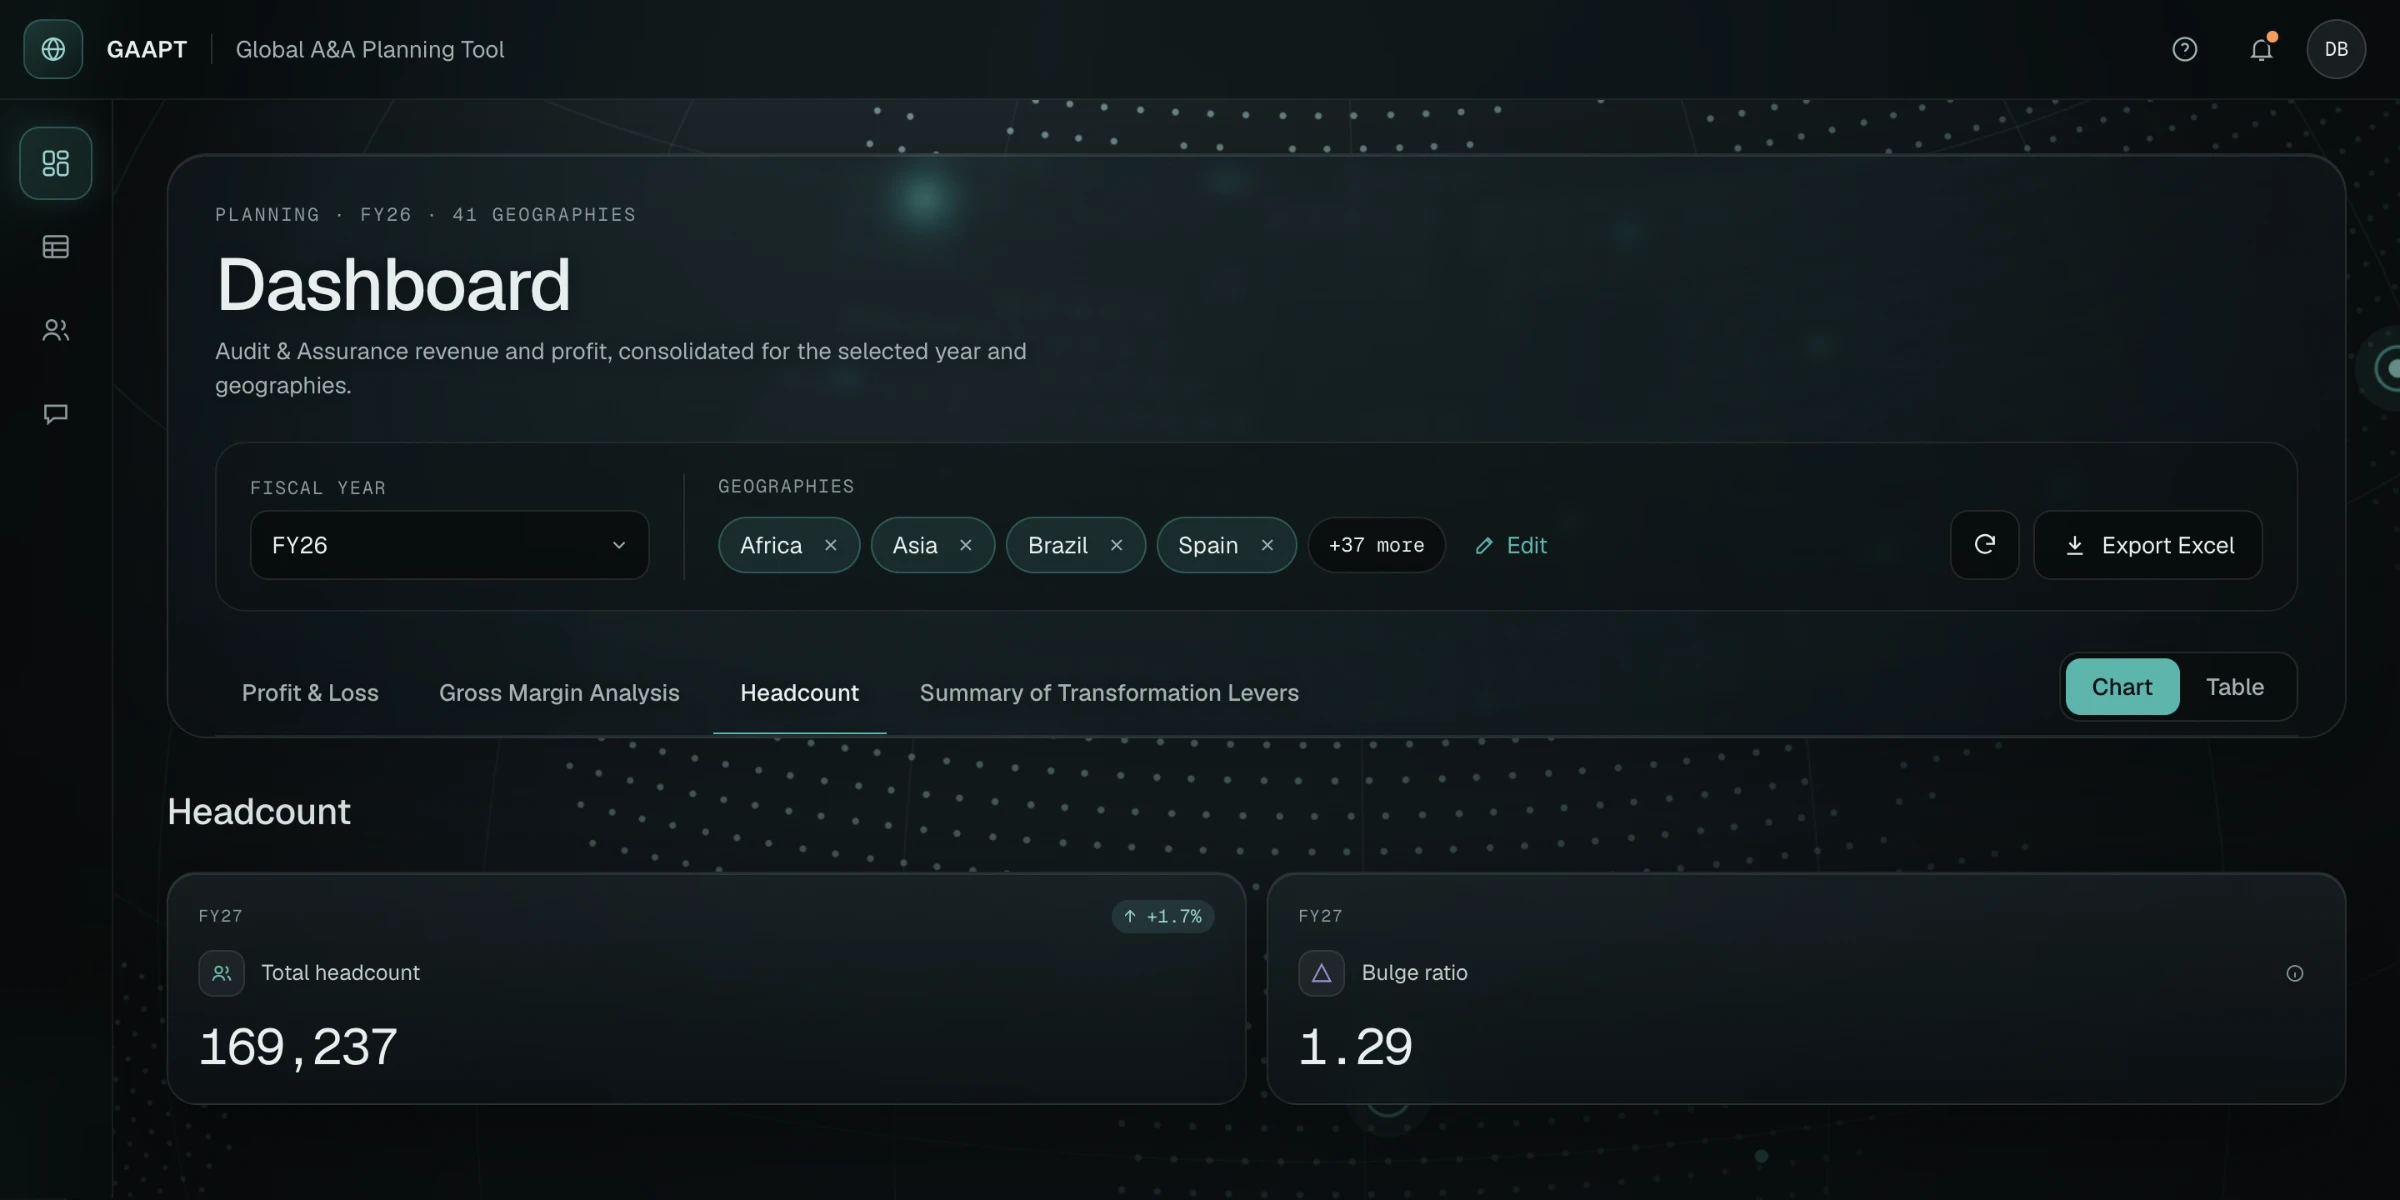
Dashboard with the Headcount tab open: four tabs under the header and two KPI tiles for total headcount and bulge ratio.
Four tabs, Headcount open.

Why

We grouped the charts into four tabs by the question they answer: Profit & Loss, Gross Margin, Headcount and Transformation Levers, and removed the charts nobody used. Less scrolling, and each tab loads only its own data.

Decision 03

Tables by blocks and levels

The problem

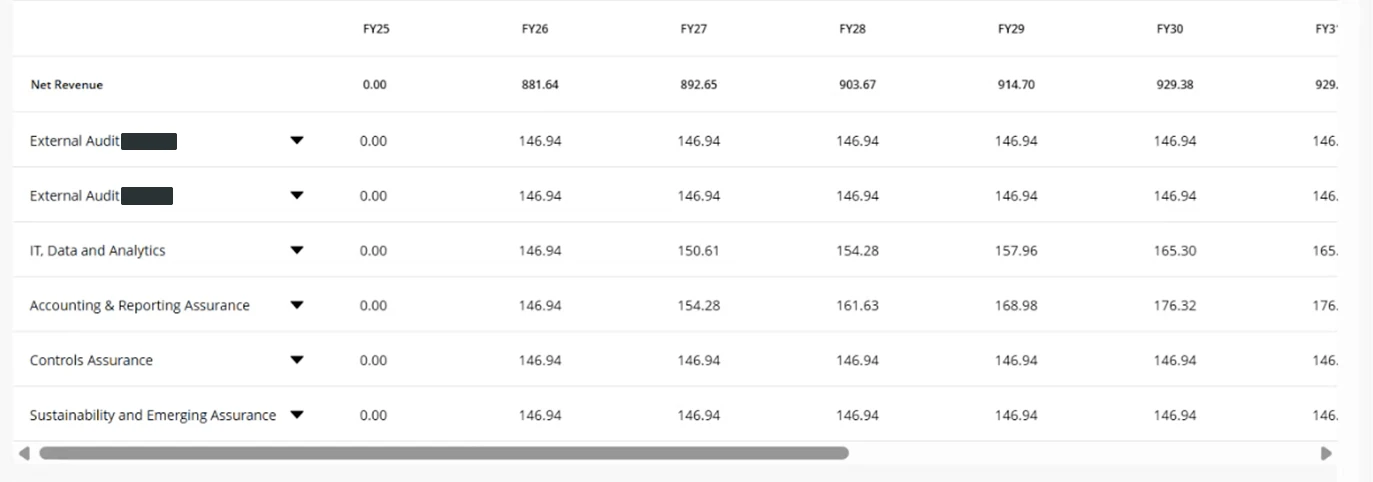
The table was a wide sheet of near-identical rows that scrolled past the edge of the screen.

Before
Legacy profit and loss table running past the right edge of the screen with a horizontal scrollbar.
A wide table with horizontal scroll.
After
Blocks open by level, all ten years on screen. Open a block or change Show to try it.

Why

Rows are grouped into blocks that open from total to subtotal, offering and country. A Show control sets the depth in one step, so a leader stays at the total and an analyst opens every country. All ten years fit on screen.

05Charts that read without hovering

Charts that read without hovering

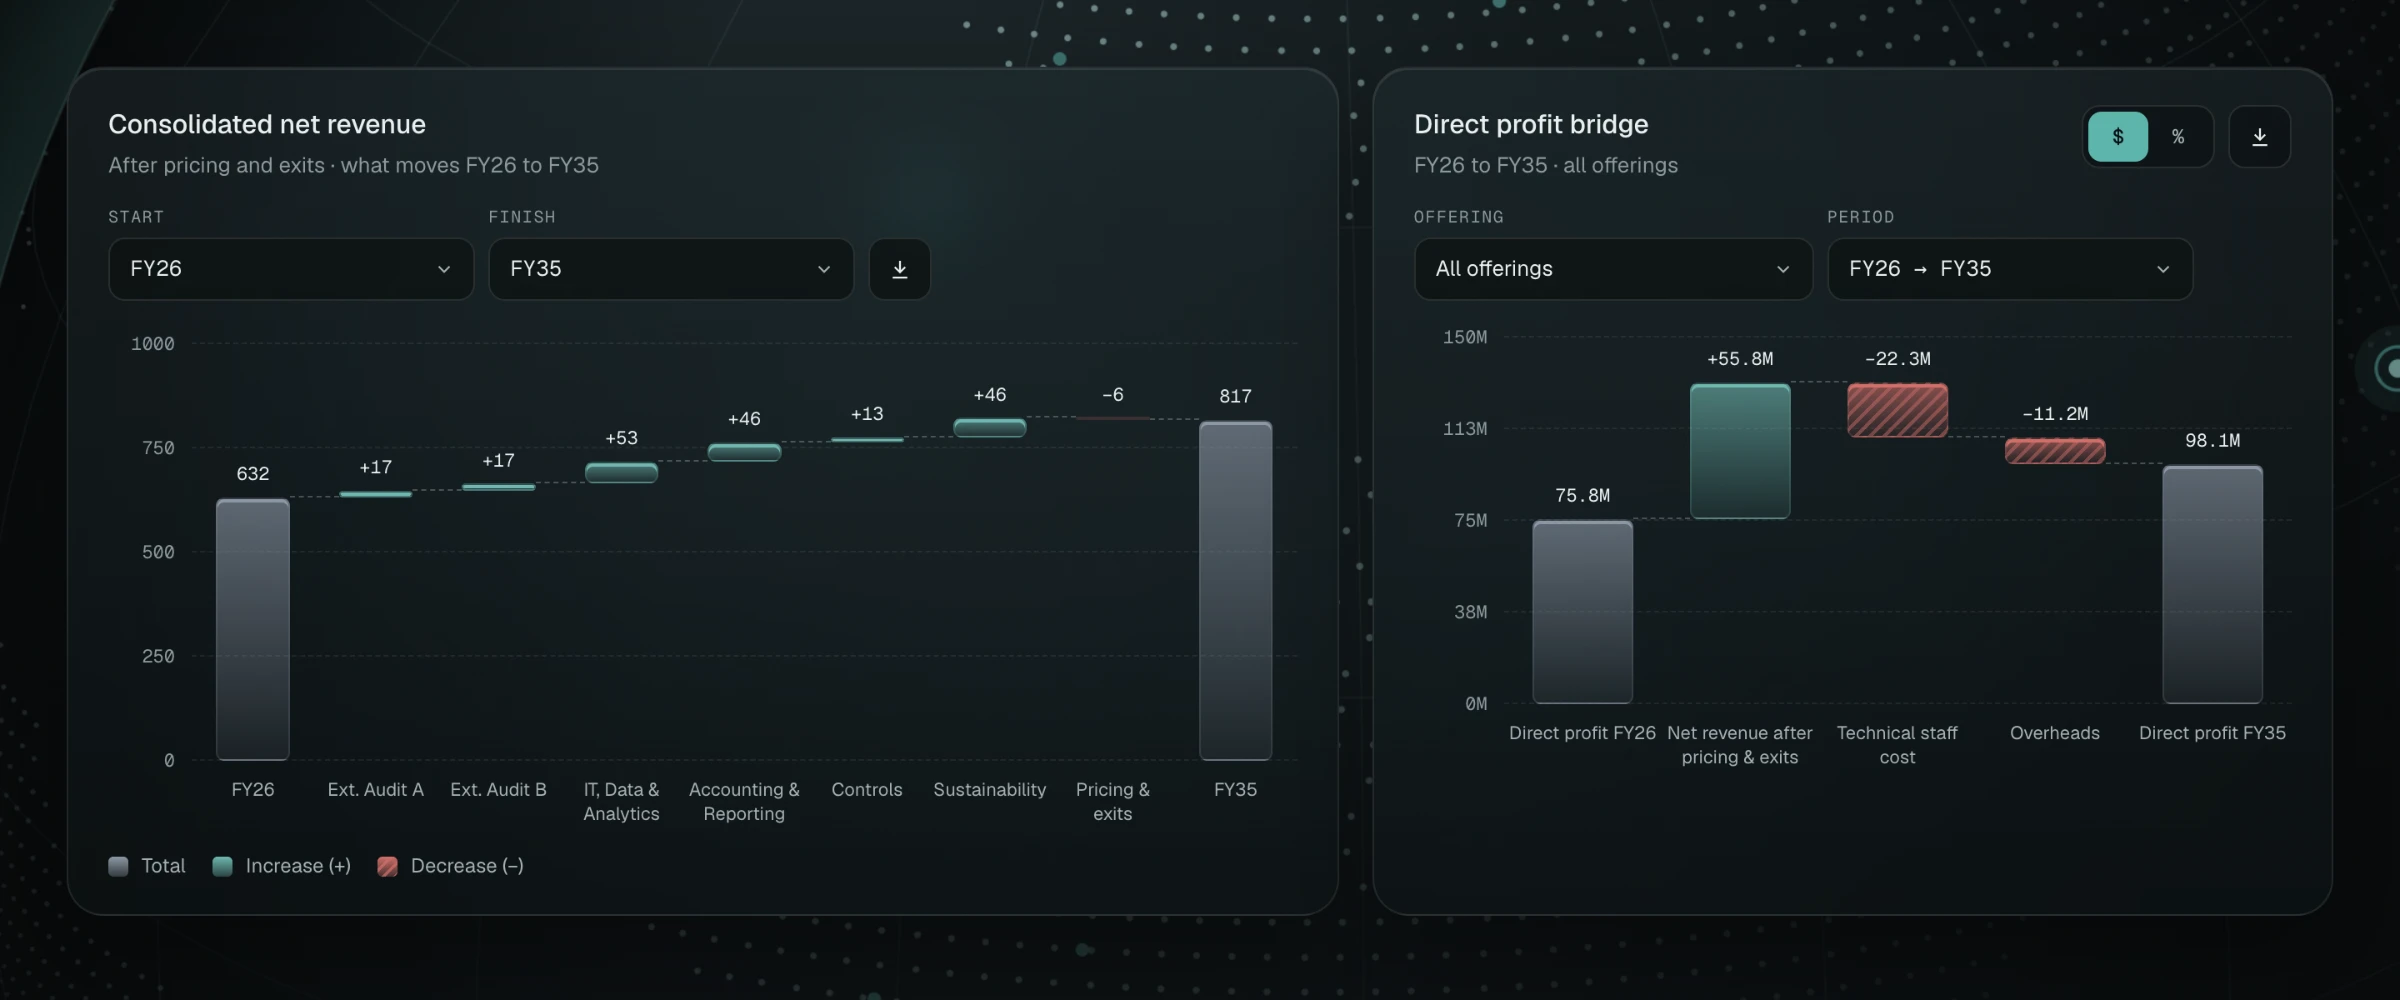
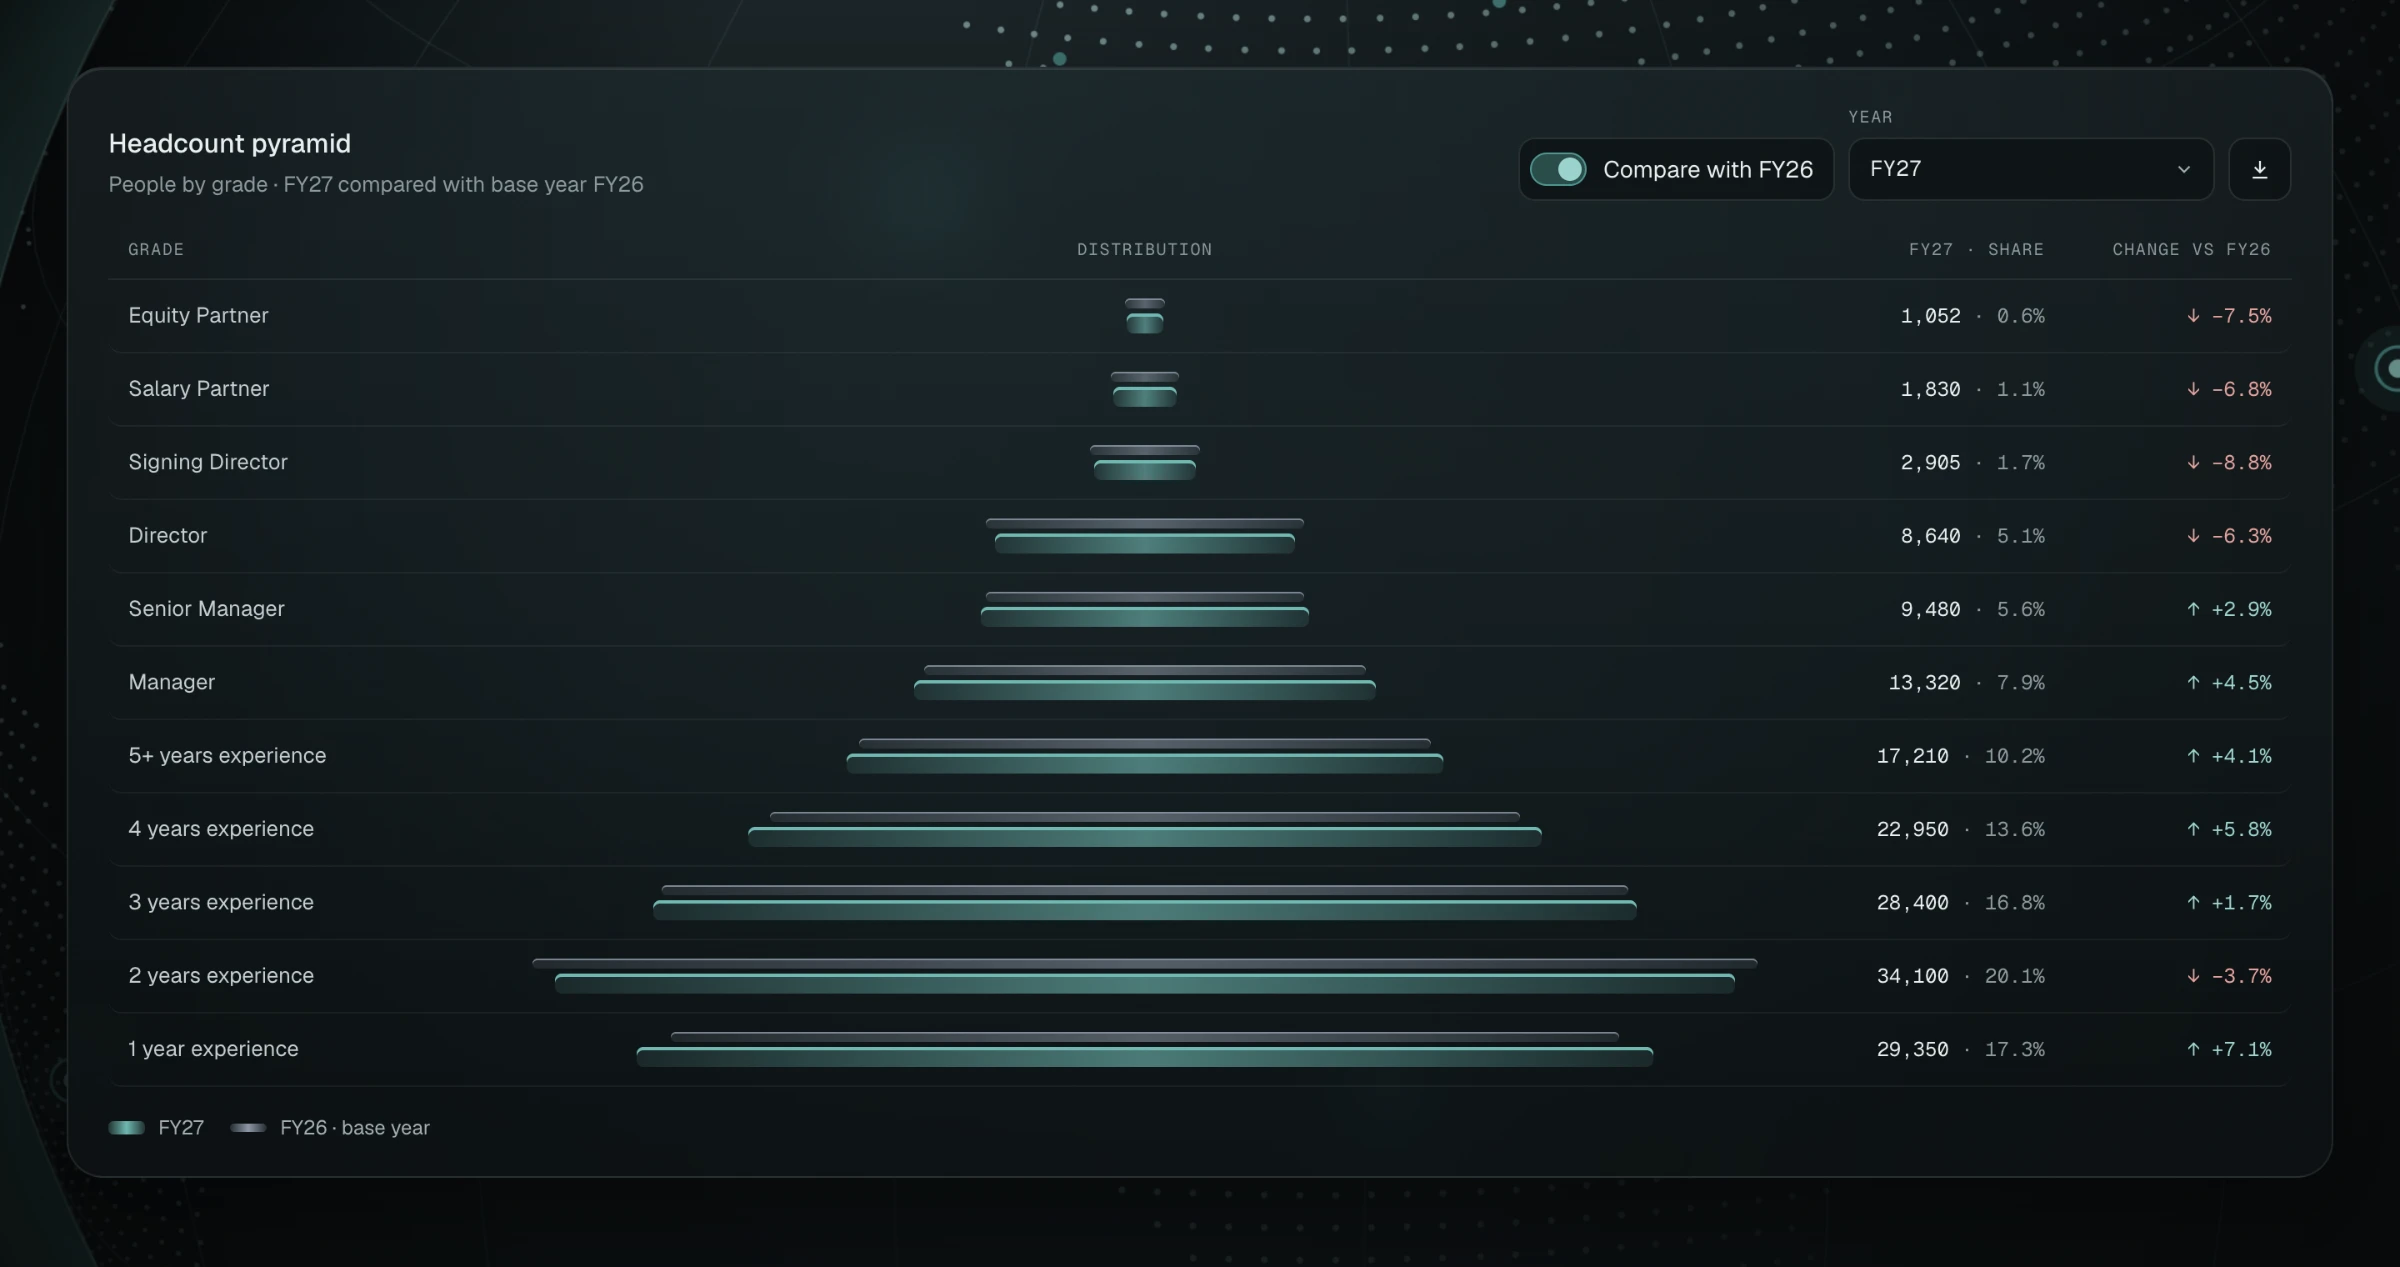
Two patterns repeat across the dashboard. Bridges show the start, every change and the end in one waterfall, with signed values above each bar and hatching on decreases. The headcount pyramid puts the number, the share and the change next to every grade, so nothing hides behind a tooltip.

Two waterfall charts: consolidated net revenue from FY26 to FY35 by offering, and a direct profit bridge, with totals, increases and hatched decreases.
Revenue and profit bridges: increases, hatched decreases and totals in one chart each.
Headcount pyramid by grade: a bar per grade for FY27 over a thinner base-year bar, with headcount, share and change for each row.
Headcount by grade, compared with the base year.
06New admin tools

New admin tools

Notification Center

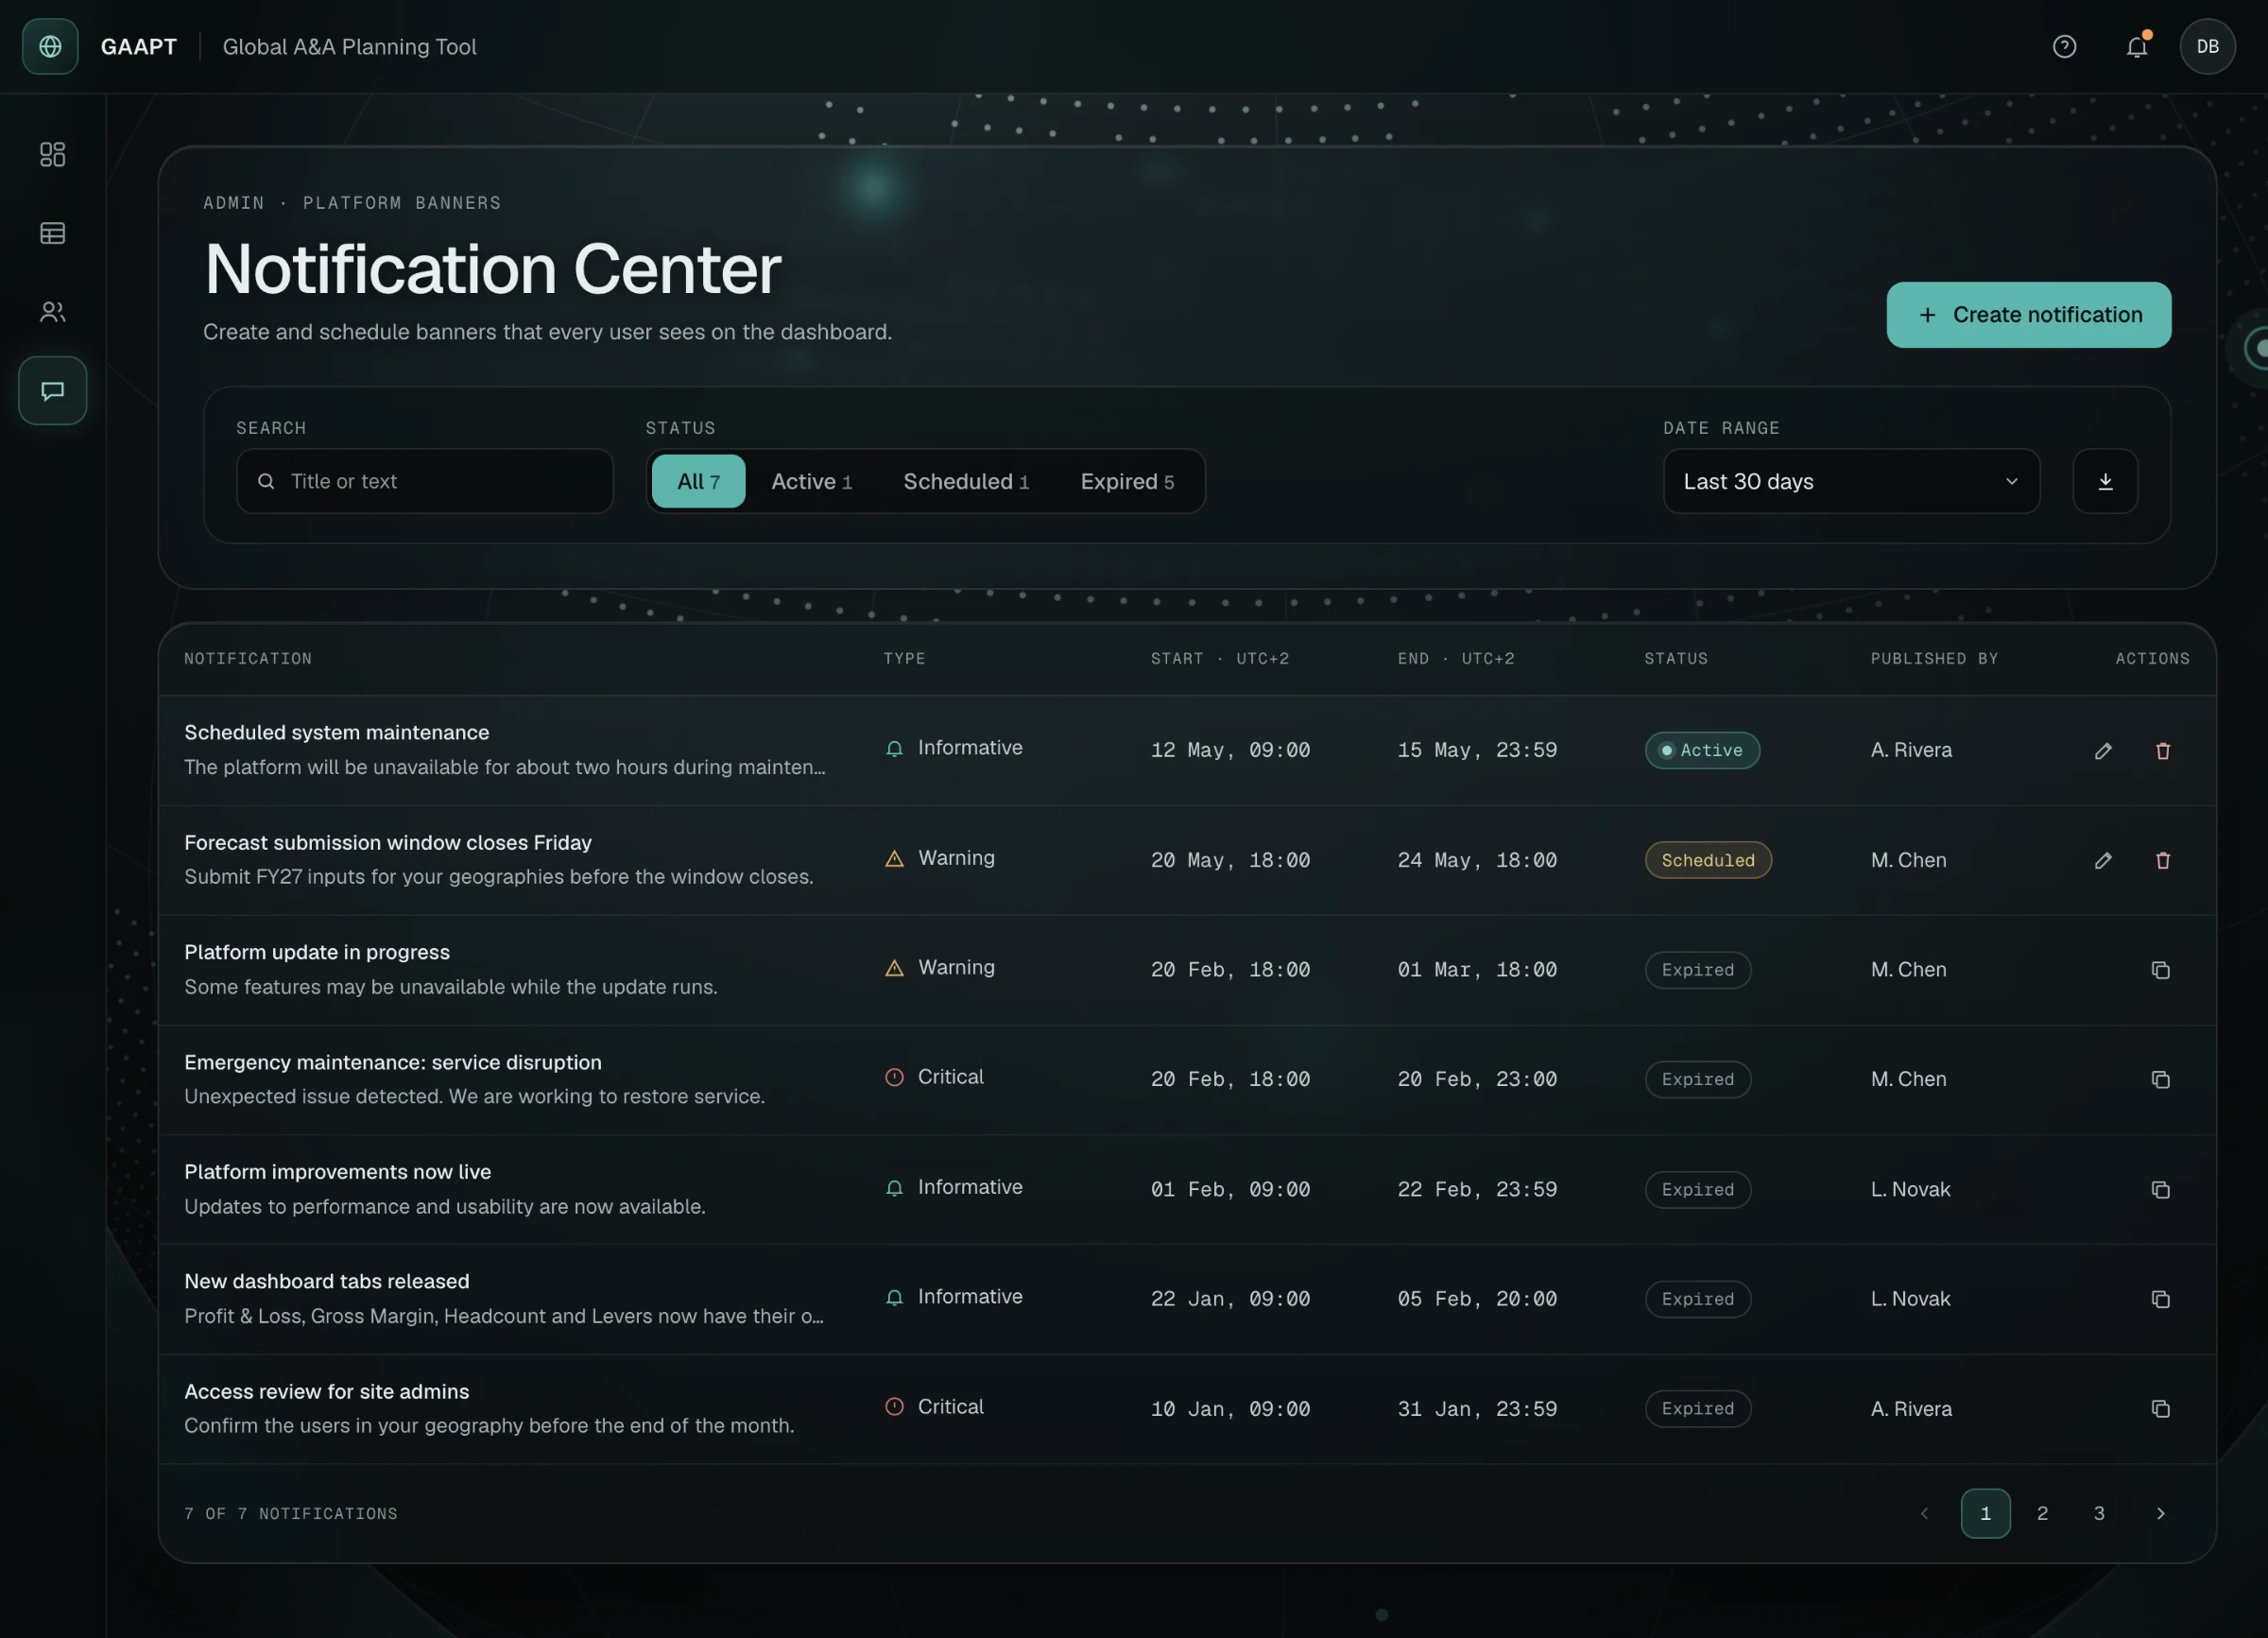
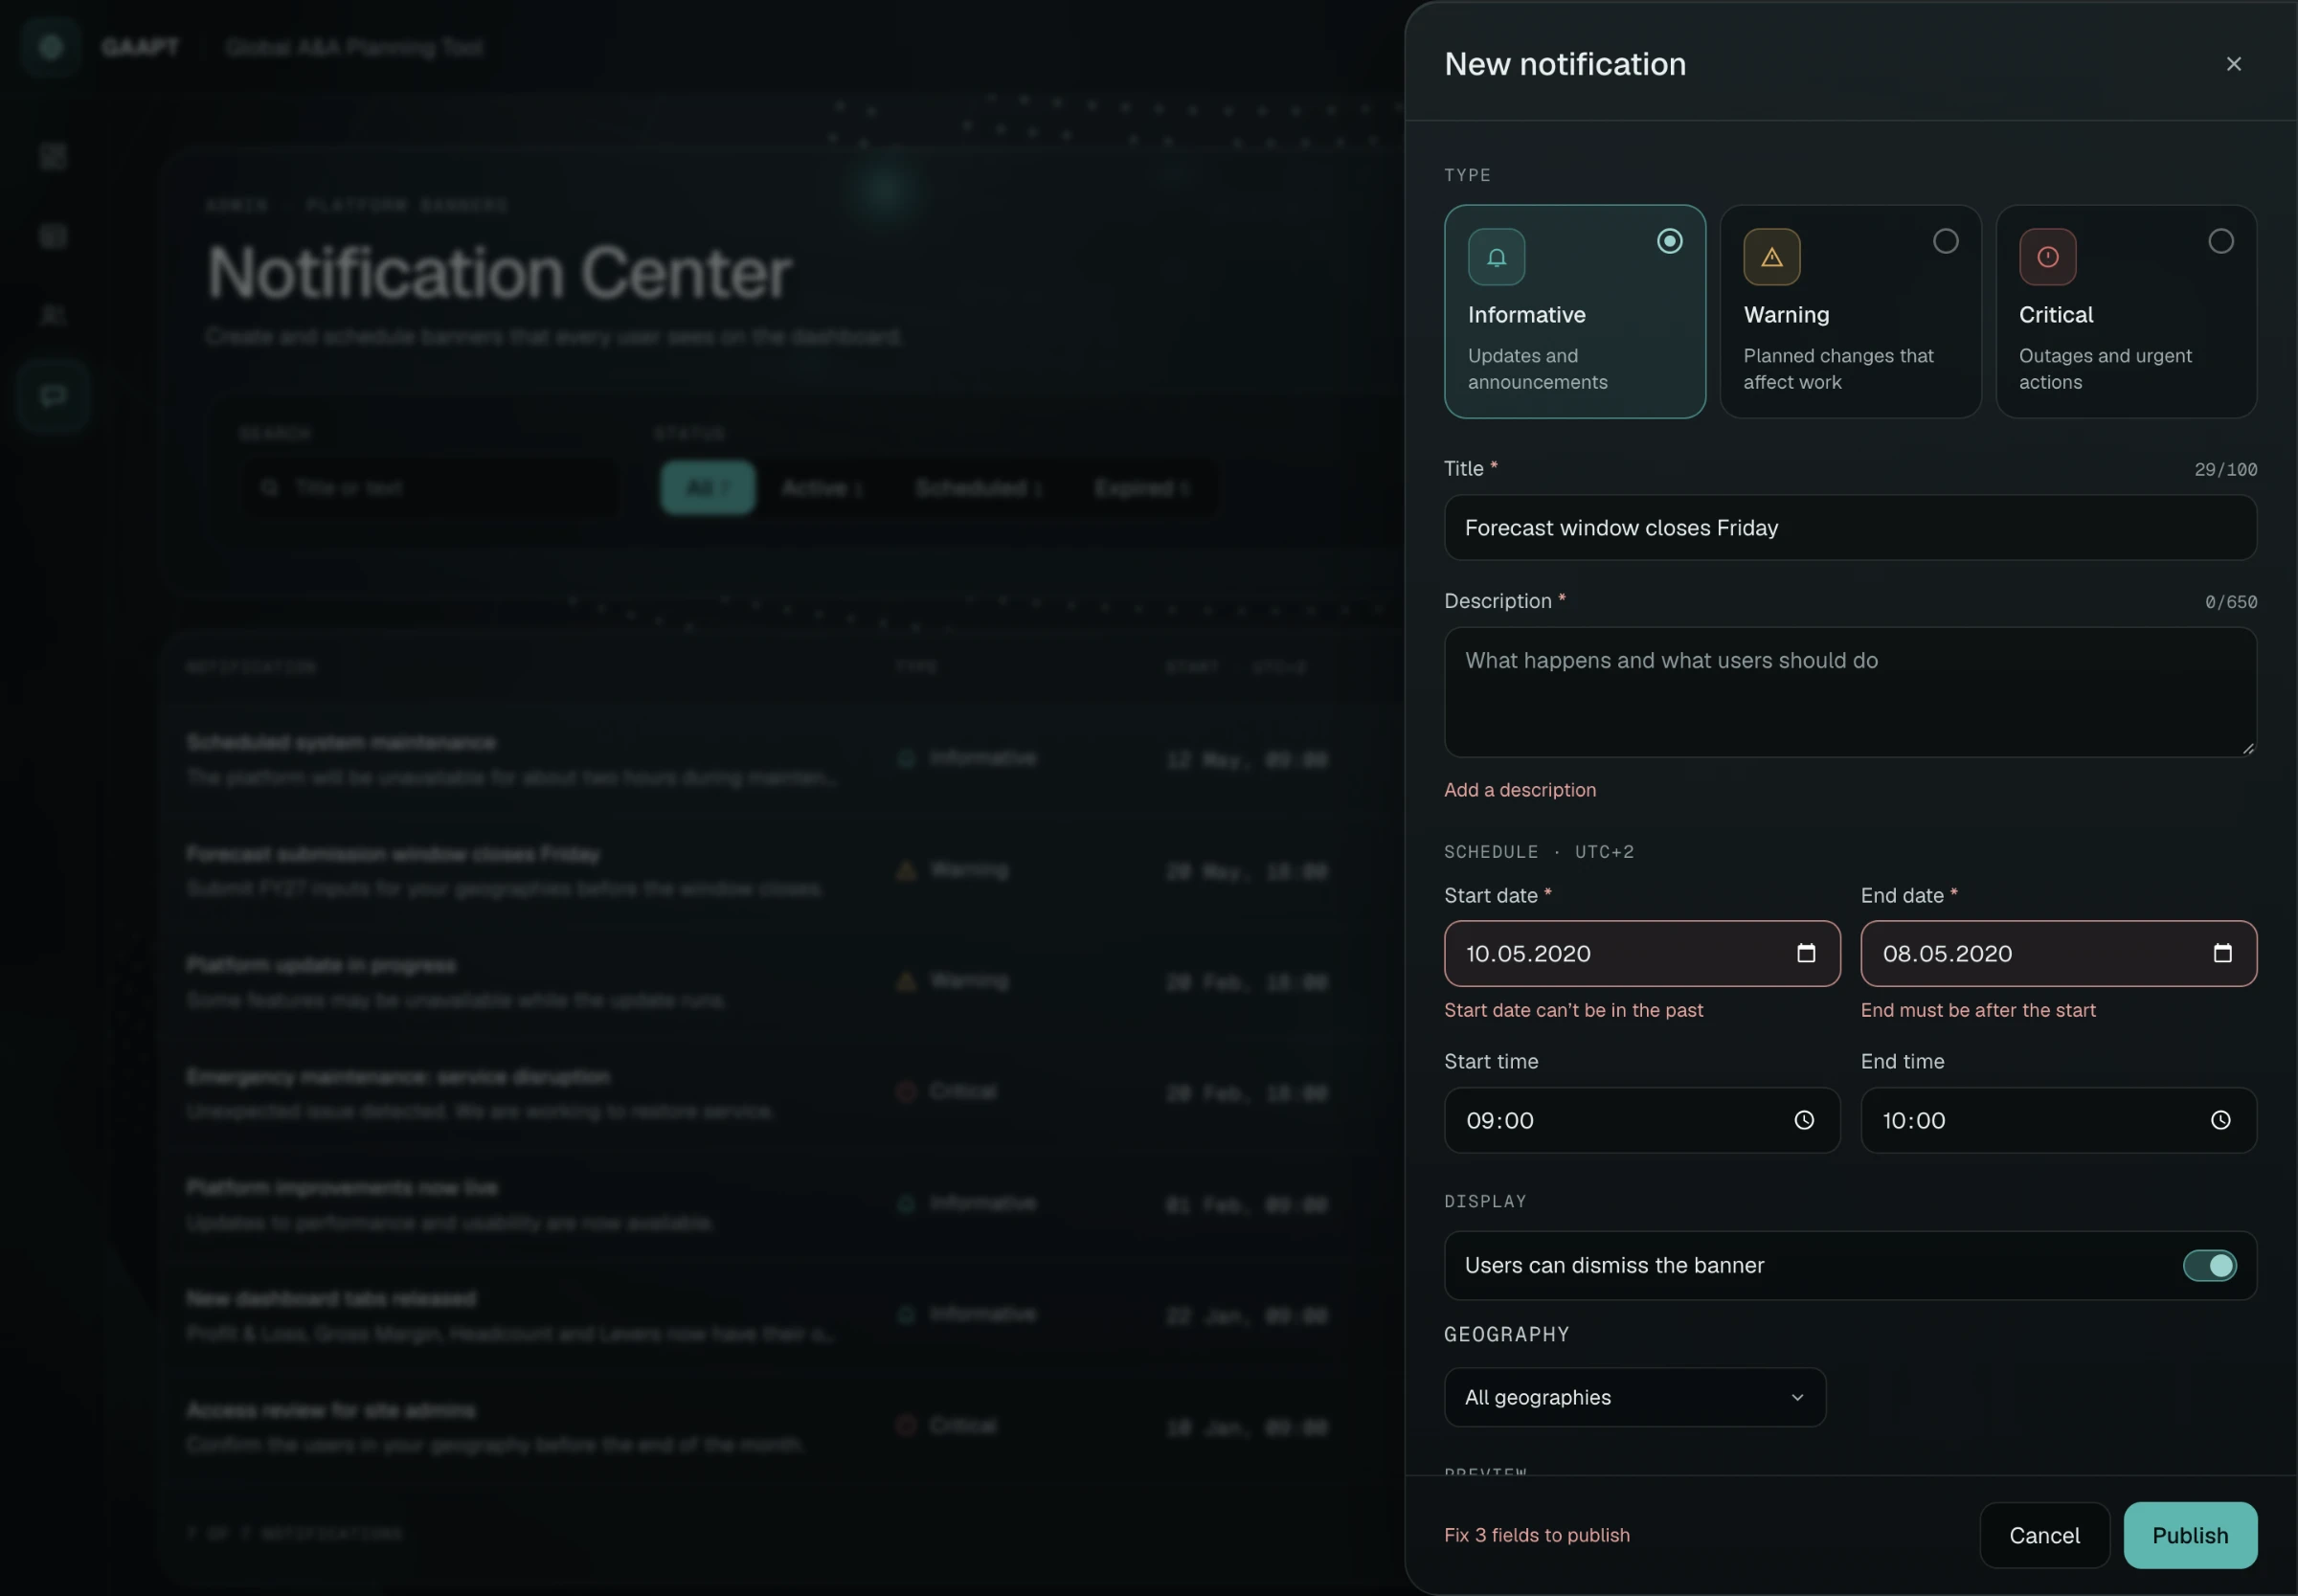
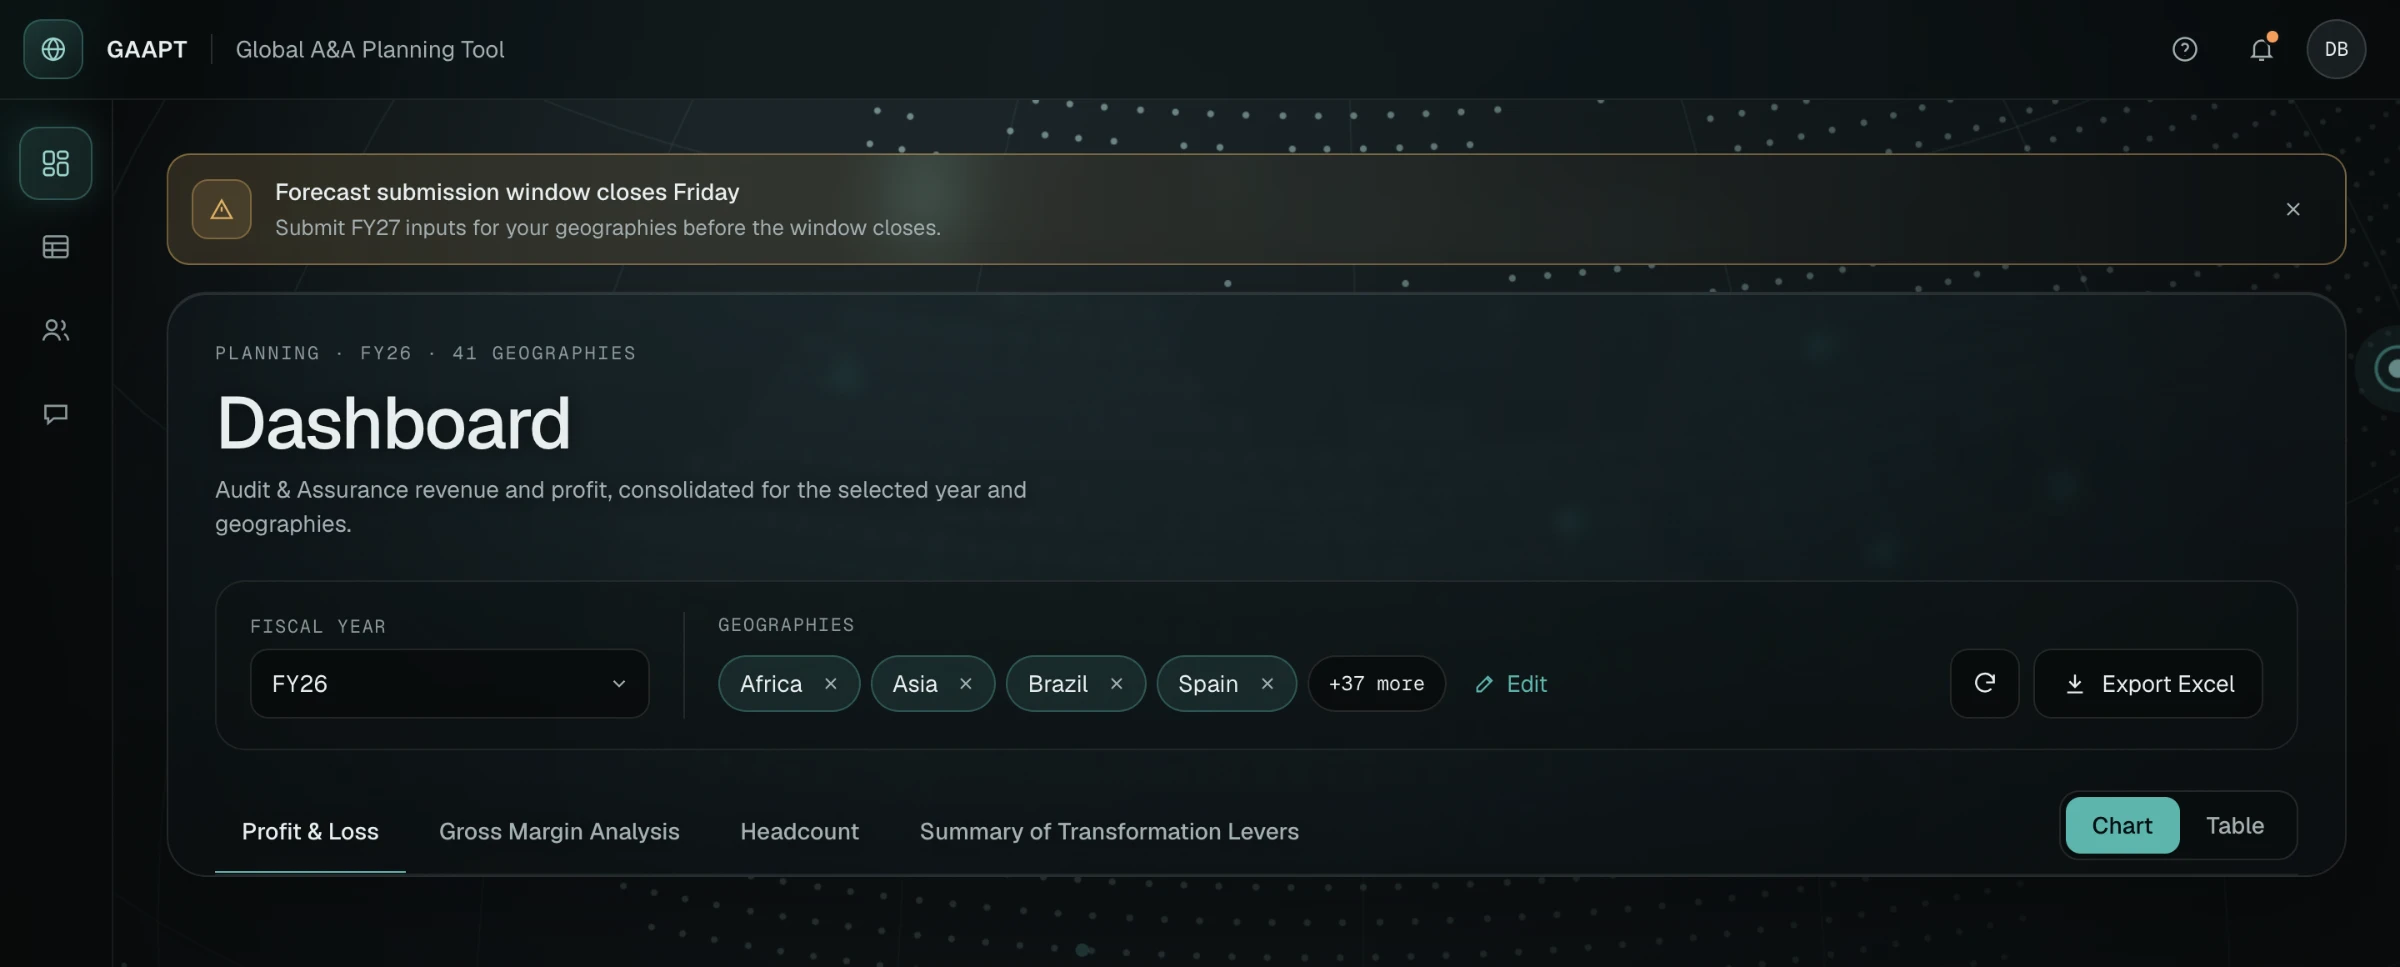
Admins needed a way to warn every user about maintenance, deadlines or outages. Notification Center lets them write a banner, pick its level, schedule it and preview it before publishing. The form checks dates and required fields inline, so errors are fixed before anything goes live.

Notification Center list with status filters and counts, and rows showing type, schedule, status and actions.
Every banner with its status at a glance.
Create-notification panel showing inline errors: a required description, a start date in the past and an end date before the start.
Inline validation in the create panel.
Dashboard with a published warning banner above the header announcing a forecast submission deadline.
The published banner on the dashboard.

User management moved to the client side too: site admins now add and remove users themselves, a job that used to go through developers and the backend.

07Visual system

Visual system

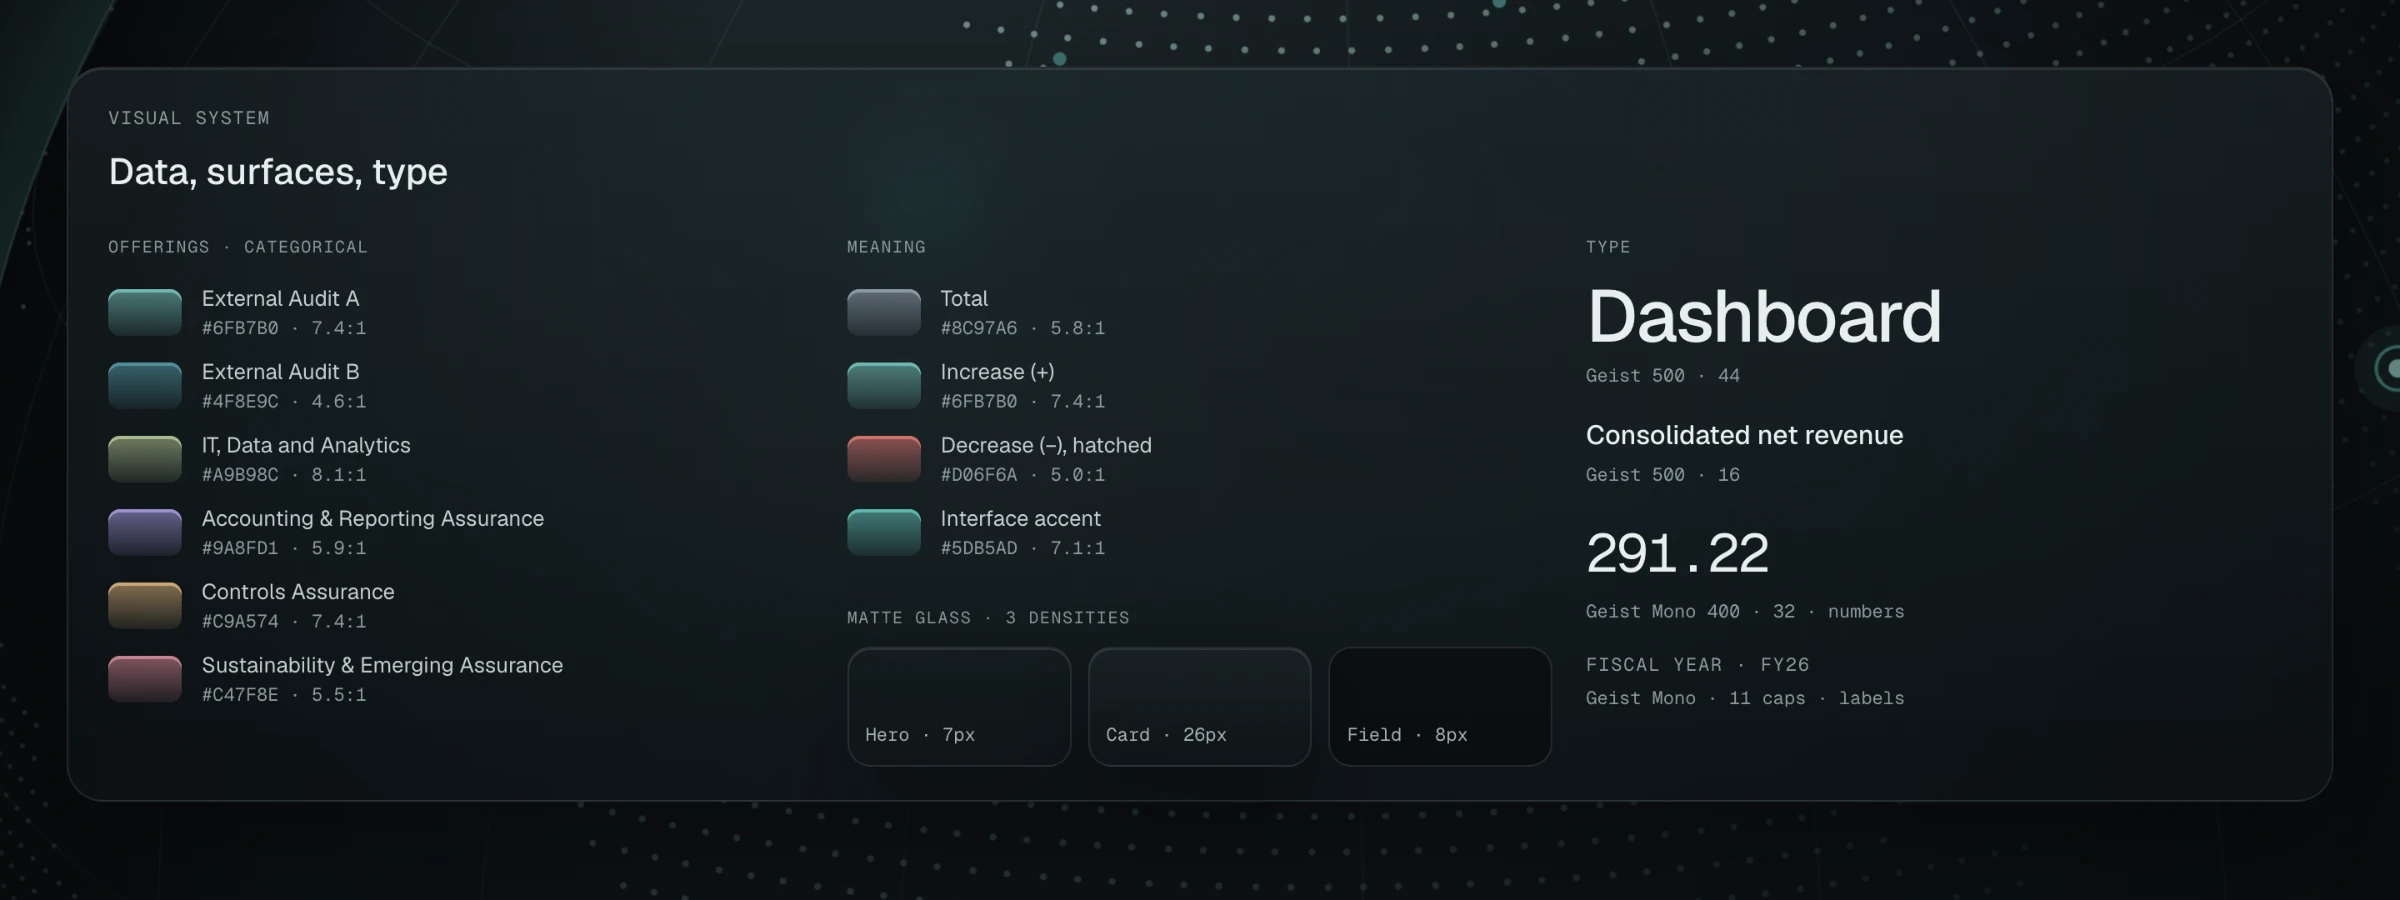
One dark system runs across every screen: a muted six-colour palette for offerings where every colour passes 4.5:1, matte glass in three densities, and Geist with Geist Mono for numbers.

Visual system: six muted data colours with contrast ratios, colours for totals, increases and decreases, three glass densities and type samples.
Data palette with contrast ratios, glass densities and type.
08Result

Result

  • Country context is always on screen and editable from the dashboard.
  • The dashboard is four focused tabs instead of one long page.
  • Admins add users and publish notifications without developers.

No usage metrics were collected. To measure the impact I would track the time it takes to change the set of countries, the number of access requests sent to developers, and dashboard load time.

09What I'd do differently

What I'd do differently

Back the cuts with data. We removed charts because users said they didn't use them; usage analytics would have made that call certain.

Test the table with the people who fill it in. Most of our calls were with leaders, while the table is the finance teams' main tool.

Next caseNext Experience Platform Start a conversation